Dosiero:CAP2004beneficiaries.png
Jen estas la maksimuma distingivo de la supra bildo.
CAP2004beneficiaries.png ((714 × 468 rastrumeroj, grandeco de dosiero: 9 KB, MIME-tipo: image/png))
| Jen dosiero de la Wikimedia-Komunejo. La priskribo en ties priskriba paĝo estas montrata suben.
|
La bildo estas kopiita de wikipedia:en. La originala priskribo estas:
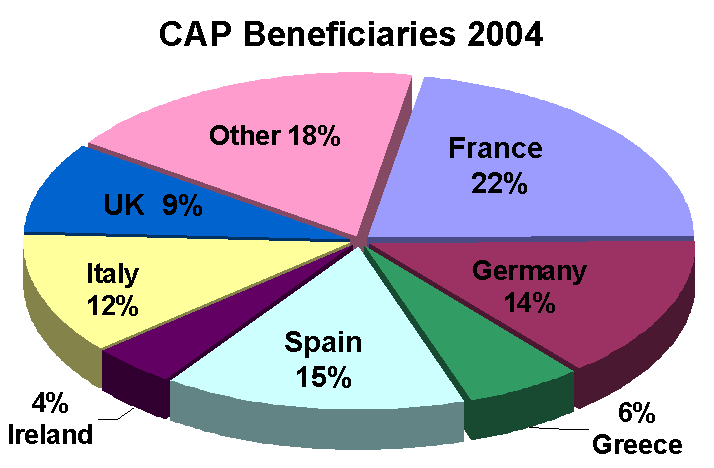
Pie chart illustrating percentage of EU spending on CAP going to different member states 2004. Drawn by me, December 2005.
| Ĉi tiu verko estis liberigita kiel publika havaĵo de ties aŭtoro, Sandpiper de angla Vikipedio. Tio aplikatas tutmonde. En iuj landoj tio povas esti laŭleĝe neebla; en tiu okazo: Sandpiper donas al iu ajn la rajton uzi ĉi tiun verkon por iu ajn uzo, sen kondiĉoj, krom se tiuj kondiĉoj deviĝas per leĝo. |
| date/time | username | edit summary |
|---|---|---|
| 13:24, 18 December 2005 | en:User:Sandpiper | (wish there was simple information of licensing tags) |
| 13:15, 18 December 2005 | en:User:Sandpiper | (Pie chart illustrating percentage of EU spending on CAP going to different member states 2004. Drawn by me, December 2005) |

|
This image shows some kind of simple graph/chart that could be converted to a Wikichart. Storing graphs or charts as images makes it harder to change (correct or translate) them. Wikicharts also help making sure to be consistent in font and size. |
|
| |

|
Tiu ĉi bildo chart respektive ĉiuj bildoj en tiu ĉi artikolo aŭ kategorio prefere estu rekreata(j) kiel vektora grafikaĵo en la formato SVG. Vektoraj formatoj por grafikaĵoj havas multajn avantaĝojn, detaloj troveblas anglalingve en la komuneja artikolo Commons:Media for cleanup. Se vi havas aŭ kreas SVG-version de tiu ĉi bildo, bonvolu alŝuti ĝin al la vikipedia komunejo. Post tiu ago, ĉi tiu ŝablono en la bildpaĝo estas anstataŭigenda per la ŝablono {{vector version available|nova dosiera nomo.svg}}.
|
Originala alŝutada protokolo
Legend: (cur) = this is the current file, (del) = delete this old version, (rev) = revert to this old version.
Click on date to download the file or see the image uploaded on that date.
- (del) (cur) 13:15, 18 December 2005 . . en:User:Sandpiper Sandpiper ( en:User_talk:Sandpiper Talk) . . 714x468 (12640 bytes) (Pie chart illustrating percentage of EU spending on CAP going to different member states 2004. Drawn by me, December 2005)
en:Image:CAP2004beneficiaries.gif
Originala alŝutada protokolo
| Dato/tempo | Dimensioj | Uzanto | Komento |
|---|---|---|---|
| la 1-a de aprilo 2006, 07:47:10 | 714 × 468 (12640 bytes) | Maksim (diskuto · kontribuoj) | La bildo estas kopiita de wikipedia:en. La originala priskribo estas: Pie chart illustrating percentage of EU spending on CAP going to different member states 2004. Drawn by me, December 2005.{{PD-user|[[User:Sandpiper|Sandpiper]]}} {| border="1" ! date |
Dosierhistorio
Alklaku iun daton kaj horon por vidi kiel la dosiero tiam aspektis.
| Dato/Horo | Bildeto | Grandecoj | Uzanto | Komento | |
|---|---|---|---|---|---|
| nun | 01:03, 28 aŭg. 2014 | | 714 × 468 (9 KB) | GifTagger | Bot: Converting file to superior PNG file. (Source: CAP2004beneficiaries.gif). This GIF was problematic due to non-greyscale color table. |
Dosiera uzado
La jena paĝo ligas al ĉi tiu dosiero:
Suma uzado de la dosiero
La jenaj aliaj vikioj utiligas ĉi tiun dosieron:
- Uzado en en.wikipedia.org
- Uzado en fr.wikipedia.org
- Uzado en ja.wikipedia.org
- Uzado en pt.wikipedia.org