Dosiero:Prisoner population rate world map.svg

Grando de tiu PNG antaŭprezento de tiu SVGa dosiero: 800 × 400 rastrumeroj. Aliaj distingivoj: 320 × 160 rastrumeroj | 640 × 320 rastrumeroj | 1 024 × 512 rastrumeroj | 1 280 × 640 rastrumeroj | 2 560 × 1 280 rastrumeroj.
Bildo en pli alta difino (SVG-dosiero, 800 × 400 rastrumeroj, grandeco de dosiero: 390 KB)
| Jen dosiero de la Wikimedia-Komunejo. La priskribo en ties priskriba paĝo estas montrata suben.
|
Resumo
| Priskribo |
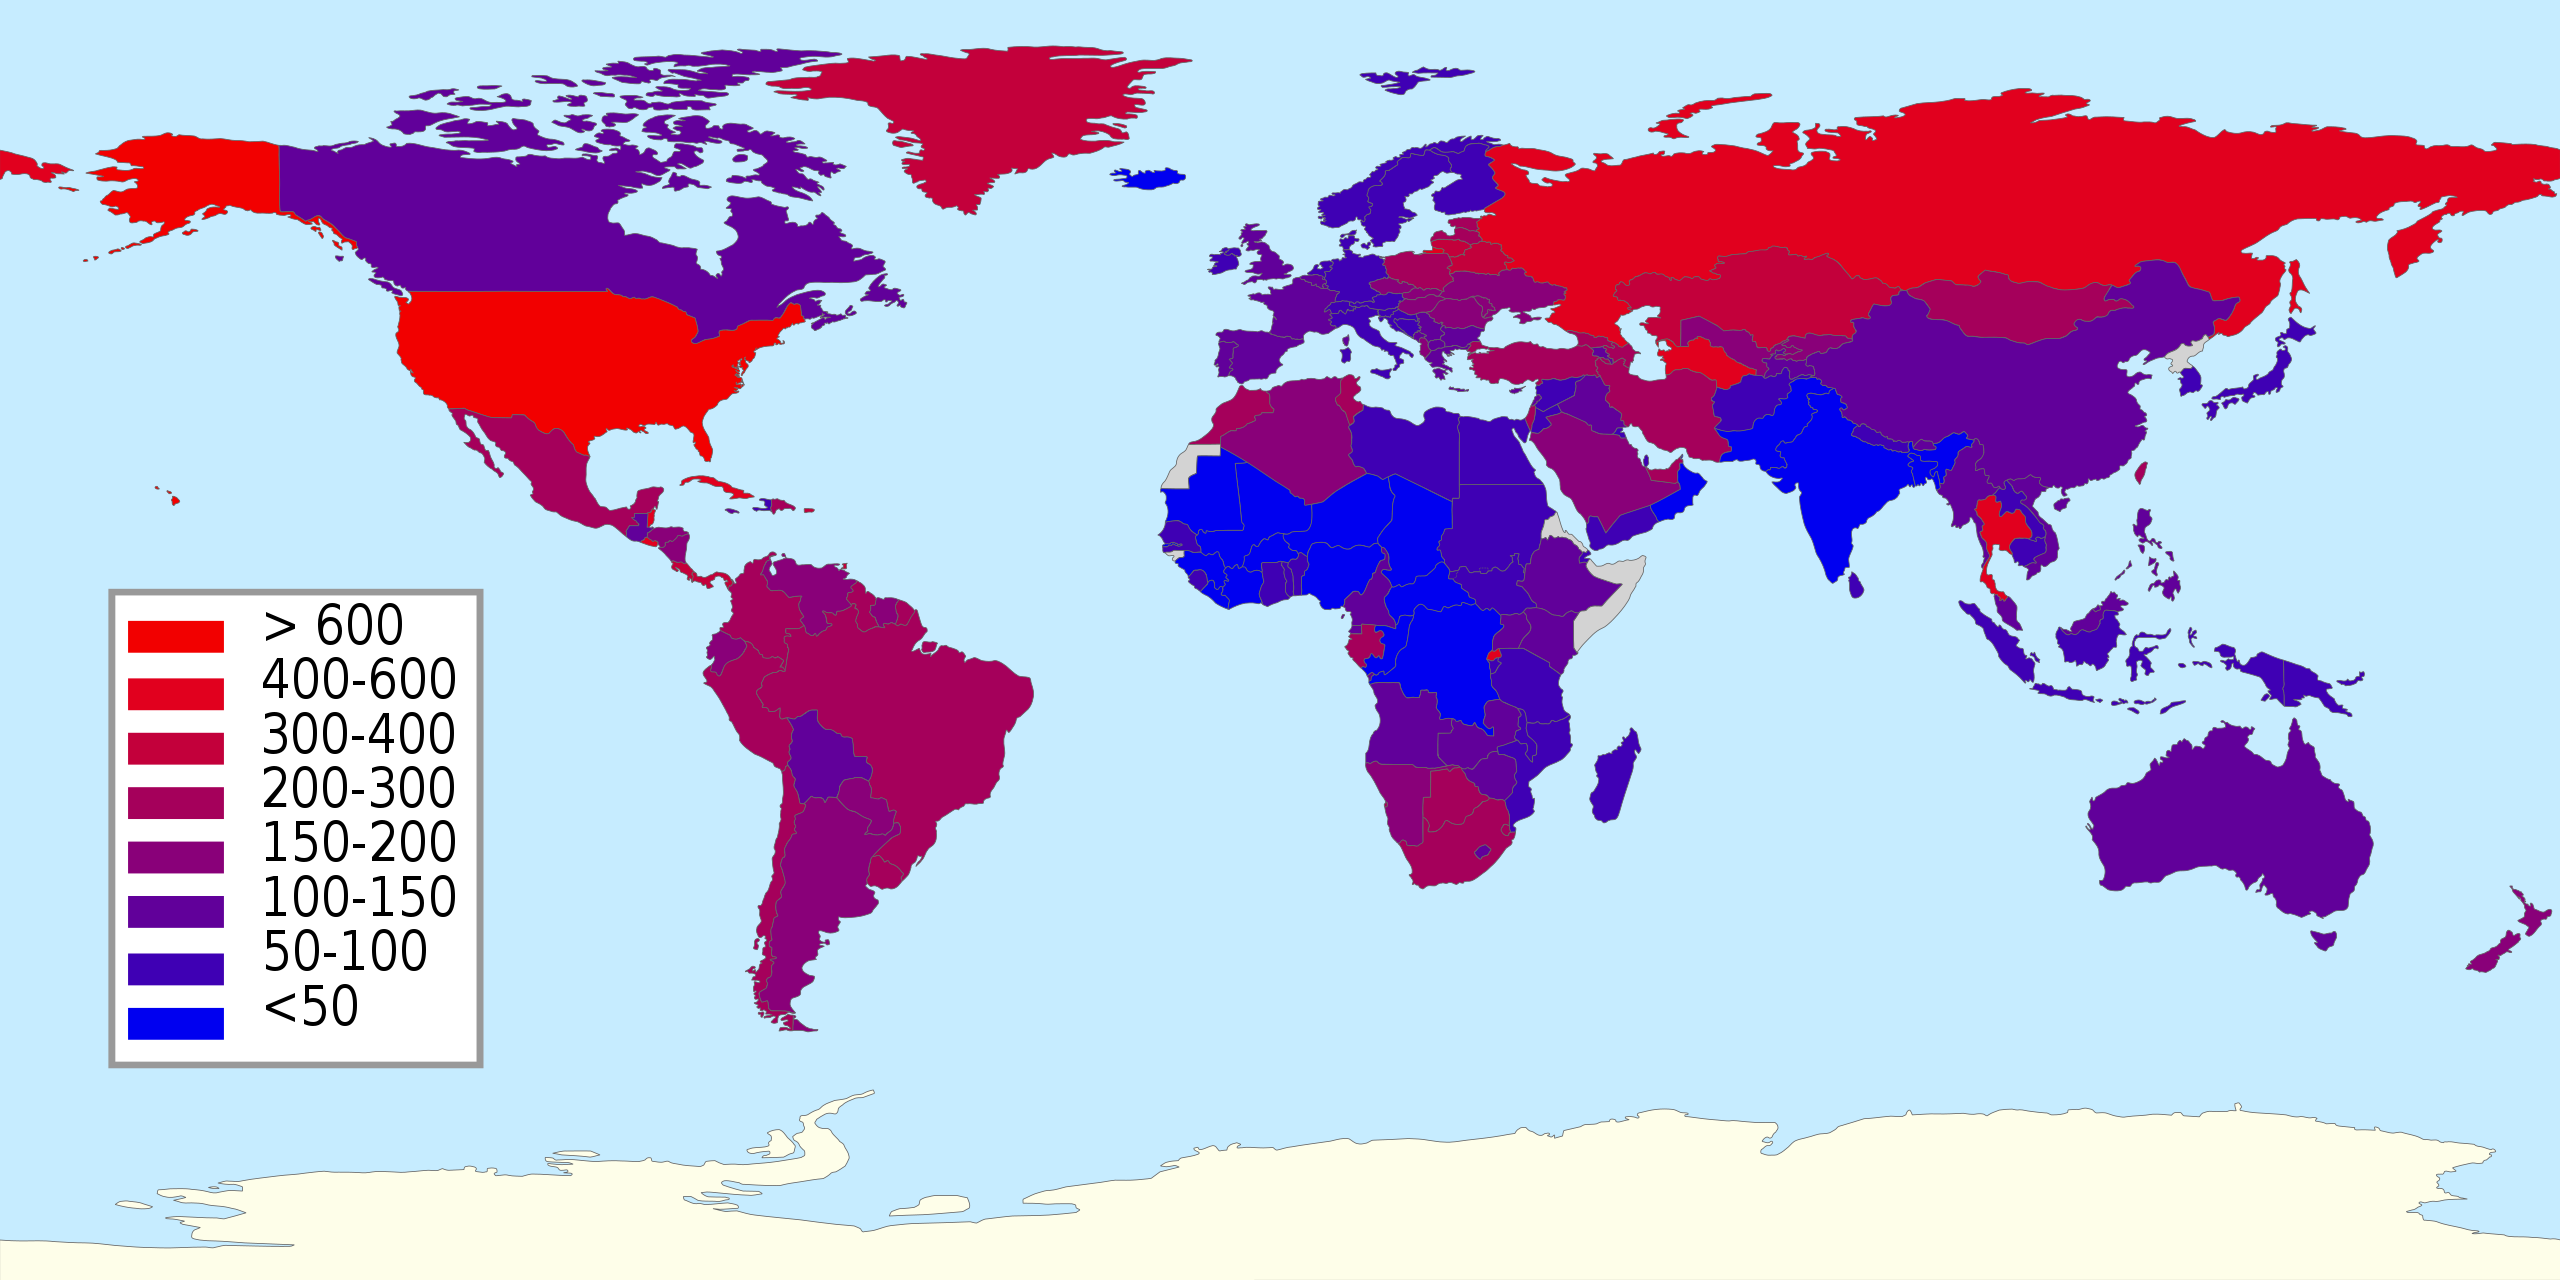
English: Prisoner population rate per 100,000 population by country. The map may be old. The latest data is here: Highest to Lowest - Prison Population Rate. From World Prison Brief. Incarceration rates are based on inmates in both prisons and jails. There is a more recent world map here: File:World map of prison population rates from World Prison Brief.svg
The map uses the following color legend: >600
400-600
300-400
200-300
150-200
100-150
50-100
<50
no data |
| Dato | 2015-01-31. Date of upload of first map. See upload history for latest dates. |
| Fonto | File:World location map.svg |
| Aŭtoro | Delphi234 |
| Country | Prisoners | Rate | Year |
|---|---|---|---|
| Afghanistan | 26,519 | 74 | 2014 |
| Albania | 5,734 | 198 | 2014 |
| Algeria | 60,220 | 162 | 2013 |
| Angola | 21,634 | 105 | 2013 |
| Argentina | 64,288 | 154 | 2013 |
| Armenia | 3,923 | 132 | 2014 |
| Australia | 35,804 | 151 | 2015 |
| Austria | 8,241 | 96 | 2014 |
| Azerbaijan | 22,526 | 236 | 2014 |
| Bangladesh | 69,719 | 43 | 2015 |
| Belarus | 29,000 | 306 | 2014 |
| Belgium | 11,769 | 105 | 2014 |
| Belize | 1,545 | 449 | 2015 |
| Benin | 7,247 | 77 | 2012 |
| Bhutan | 1,084 | 143 | 2013 |
| Bolivia | 14,587 | 134 | 2014 |
| Bosnia and Herzegovina: Federation | 1,883 | 80 | 2013 |
| Botswana | 3,826 | 188 | 2013 |
| Brazil | 607,731 | 301 | 2014 |
| Brunei Darussalam | 594 | 129 | 2014 |
| Bulgaria | 9,028 | 125 | 2014 |
| Burkina Faso | 6,251 | 34 | 2014 |
| Burma (Myanmar) | 60,000 | 113 | 2013 |
| Burundi | 8,646 | 93 | 2014 |
| Cambodia | 16,497 | 105 | 2015 |
| Cameroon | 25,337 | 115 | 2012 |
| Canada | 37,864 | 106 | 2014 |
| Central African Republic | 845 | 19 | 2011 |
| Chad | 4,831 | 39 | 2011 |
| Chile | 42,829 | 240 | 2015 |
| China | 1,657,812 | 119 | 2014 |
| Colombia | 120,905 | 244 | 2015 |
| Congo (Brazzaville) | 1,240 | 27 | 2014 |
| Costa Rica | 17,440 | 352 | 2014 |
| Croatia | 3,853 | 91 | 2014 |
| Cuba | 57,337 | 510 | 2012 |
| Cyprus (Republic of) | 811 | 94 | 2013 |
| Czech Republic | 20,304 | 192 | 2015 |
| Democratic Republic of Congo (formerly Zaire) | 22,000 | 35 | 2010 |
| Denmark | 3,481 | 61 | 2015 |
| Djibouti | 600 | 68 | 2014 |
| Dominican Republic | 24,832 | 233 | 2015 |
| Ecuador | 25,902 | 162 | 2014 |
| Egypt | 270,000 | 284 | 2017 |
| El Salvador | 29,925 | 465 | 2015 |
| England & Wales (United Kingdom) | 86,179 | 148 | 2015 |
| Equatorial Guinea | 1,000 | 132 | 2013 |
| Eritrea | |||
| Estonia | 2,862 | 218 | 2015 |
| Ethiopia | 93,044 | 111 | 2011 |
| Finland | 3,105 | 57 | 2015 |
| France | 66,864 | 100 | 2015 |
| French Guiana/Guyane (France) | 726 | 277 | 2015 |
| Gabon | 3,500 | 210 | 2013 |
| Gambia | 914 | 48 | 2014 |
| Georgia | 10,493 | 281 | 2015 |
| Germany | 63,628 | 78 | 2015 |
| Ghana | 14,297 | 53 | 2015 |
| Greece | 11,988 | 111 | 2014 |
| Greenland (Denmark) | 116 | 208 | 2015 |
| Guatemala | 19,021 | 117 | 2015 |
| Guinea (Republic of Guinea) | 2,600 | 22 | 2013 |
| Guinea Bissau | 92 | 2013 | |
| Guyana | 1,998 | 264 | 2013 |
| Haiti | 10,266 | 97 | 2015 |
| Honduras | 16,331 | 196 | 2014 |
| Hungary | 17,716 | 180 | 2015 |
| Iceland | 147 | 45 | 2014 |
| India | 411,992 | 33 | 2013 |
| Indonesia | 161,692 | 64 | 2014 |
| Iran | 225,624 | 290 | 2014 |
| Iraq | 45,634 | 133 | 2013 |
| Ireland, Republic of | 3,791 | 82 | 2015 |
| Israel | 18,658 | 240 | 2013 |
| Italy | 52,144 | 86 | 2015 |
| Ivory Coast (Cote d'Ivoire) | 10,850 | 52 | 2014 |
| Jamaica | 4,050 | 145 | 2014 |
| Japan | 61,794 | 49 | 2014 |
| Jordan | 10,089 | 150 | 2014 |
| Kazakhstan | 47,939 | 275 | 2015 |
| Kenya | 54,154 | 119 | 2015 |
| Kuwait | 2,900 | 86 | 2013 |
| Kyrgyzstan | 10,060 | 182 | 2013 |
| Laos | 4,020 | 71 | 2004 |
| Latvia | 4,745 | 239 | 2014 |
| Lebanon | 6,012 | 120 | 2014 |
| Lesotho | 2,073 | 92 | 2014 |
| Liberia | 1,719 | 39 | 2014 |
| Libya | 6,187 | 99 | 2014 |
| Lithuania | 8,848 | 302 | 2014 |
| Luxembourg | 631 | 112 | 2015 |
| Macedonia (former Yugoslav Republic of) | 3,034 | 147 | 2014 |
| Madagascar | 18,719 | 83 | 2013 |
| Malawi | 12,156 | 72 | 2014 |
| Malaysia | 49,200 | 161 | 2015 |
| Mali | 4,963 | 33 | 2013 |
| Mauritania | 1,768 | 44 | 2014 |
| Mexico | 255,138 | 212 | 2015 |
| Moldova (Republic of) | 7,643 | 215 | 2015 |
| Mongolia | 7,773 | 264 | 2014 |
| Montenegro | 1,083 | 174 | 2014 |
| Morocco | 76,000 | 227 | 2015 |
| Mozambique | 15,663 | 62 | 2013 |
| Namibia | 3,560 | 144 | 2015 |
| Nepal | 16,813 | 52 | 2014 |
| Netherlands | 12,638 | 75 | 2013 |
| New Zealand | 8,641 | 190 | 2014 |
| Nicaragua | 9,800 | 160 | 2013 |
| Niger | 7,116 | 40 | 2013 |
| Nigeria | 57,121 | 32 | 2014 |
| North Korea | |||
| Northern Ireland (United Kingdom) | 1,666 | 90 | 2015 |
| Norway | 3,710 | 71 | 2015 |
| Oman | 1,300 | 36 | 2013 |
| Pakistan | 80,169 | 43 | 2015 |
| Panama | 15,508 | 392 | 2015 |
| Papua New Guinea | 4,580 | 61 | 2014 |
| Paraguay | 10,949 | 158 | 2014 |
| Peru | 73,255 | 236 | 2015 |
| Philippines | 120,076 | 120 | 2014 |
| Poland | 75,691 | 199 | 2015 |
| Portugal | 14,293 | 138 | 2015 |
| Puerto Rico (USA) | 12,551 | 351 | 2013 |
| Qatar | 1,150 | 53 | 2013 |
| Romania | 29,312 | 148 | 2015 |
| Russian Federation | 649,500 | 450 | 2015 |
| Rwanda | 55,618 | 492 | 2012 |
| Saudi Arabia | 47,000 | 161 | 2013 |
| Scotland (United Kingdom) | 7,760 | 145 | 2015 |
| Senegal | 8,630 | 62 | 2014 |
| Serbia | 10,031 | 140 | 2013 |
| Sierra Leone | 3,792 | 61 | 2014 |
| Slovakia | 10,141 | 187 | 2015 |
| Slovenia | 1,511 | 73 | 2015 |
| Somalia | 3,450 | 2012 | |
| South Africa | 159,241 | 292 | 2015 |
| South Korea (Republic of Korea) | 50,800 | 104 | 2014 |
| South Sudan | 7,500 | 65 | 2013 |
| Spain | 64,835 | 140 | 2015 |
| Sri Lanka | 19,774 | 92 | 2014 |
| Sudan | 19,101 | 50 | 2013 |
| Suriname | 1,000 | 183 | 2014 |
| Swaziland | 3,616 | 289 | 2014 |
| Sweden | 5,779 | 60 | 2014 |
| Switzerland | 6,923 | 84 | 2014 |
| Syria | 10,599 | 60 | 2004 |
| Taiwan | 63,108 | 269 | 2015 |
| Tajikistan | 9,317 | 121 | 2010 |
| Tanzania | 34,196 | 69 | 2014 |
| Thailand | 308,111 | 457 | 2015 |
| Togo | 4,493 | 64 | 2014 |
| Trinidad and Tobago | 3,481 | 259 | 2014 |
| Tunisia | 23,686 | 212 | 2014 |
| Turkey | 165,033 | 212 | 2015 |
| Turkmenistan | 30,568 | 583 | 2013 |
| Uganda | 42,013 | 110 | 2015 |
| Ukraine | 71,325 | 195 | 2015 |
| United Arab Emirates | 11,193 | 229 | 2006 |
| United States | 2,217,000 | 698 | 2013 |
| Uruguay | 9,632 | 282 | 2014 |
| Uzbekistan | 46,200 | 160 | 2013 |
| Venezuela | 55,007 | 178 | 2014 |
| Vietnam | 142,636 | 154 | 2014 |
| Western Sahara | |||
| Yemen | 14,000 | 53 | 2013 |
| Zambia | 17,160 | 118 | 2014 |
| Zimbabwe | 18,857 | 145 | 2015 |
Not shown on map:
| Country | Prisoners | Rate | Year |
|---|---|---|---|
| American Samoa (USA) | 192 | 349 | 2012 |
| Andorra | 55 | 72 | 2014 |
| Anguilla (United Kingdom) | 57 | 407 | 2014 |
| Antigua and Barbuda | 331 | 355 | 2014 |
| Aruba (Netherlands) | 170 | 165 | 2014 |
| Bahamas | 1,396 | 363 | 2014 |
| Bahrain | 4,028 | 301 | 2013 |
| Barbados | 884 | 309 | 2014 |
| Bermuda (United Kingdom) | 230 | 354 | 2014 |
| Bosnia and Herzegovina: Republika Srpska | 940 | 71 | 2014 |
| Cape Verde (Cabo Verde) | 1,434 | 286 | 2013 |
| Cayman Islands (United Kingdom) | 190 | 344 | 2014 |
| Comoros | 233 | 31 | 2014 |
| Cook Islands (New Zealand) | 25 | 109 | 2011 |
| Curaçao (Netherlands) | 348 | 225 | 2014 |
| Dominica | 238 | 350 | 2013 |
| Faeroe Islands (Denmark) | 9 | 19 | 2013 |
| Fiji | 1,520 | 171 | 2014 |
| French Polynesia (France) | 451 | 159 | 2012 |
| Gibraltar (United Kingdom) | 48 | 146 | 2013 |
| Grenada | 456 | 430 | 2013 |
| Guadeloupe (France) | 913 | 192 | 2015 |
| Guam (USA) | 797 | 469 | 2015 |
| Guernsey (United Kingdom) | 96 | 148 | 2014 |
| Hong Kong (China) | 8,284 | 114 | 2015 |
| Isle of Man (United Kingdom) | 86 | 99 | 2015 |
| Jersey (United Kingdom) | 133 | 132 | 2014 |
| Kiribati | 120 | 115 | 2014 |
| Kosovo/Kosova | 1,816 | 100 | 2014 |
| Liechtenstein | 7 | 19 | 2014 |
| Macau (China) | 1,223 | 190 | 2015 |
| Maldives | 1,200 | 341 | 2014 |
| Malta | 582 | 135 | 2015 |
| Marshall Islands | 35 | 66 | 2014 |
| Martinique (France) | 949 | 231 | 2015 |
| Mauritius | 2,123 | 160 | 2015 |
| Mayotte (France) | 173 | 74 | 2015 |
| Micronesia, Federated States of | 132 | 127 | 2014 |
| Monaco | 23 | 61 | 2014 |
| Nauru | 14 | 140 | 2014 |
| New Caledonia (France) | 459 | 169 | 2015 |
| Northern Mariana Islands (USA) | 168 | 267 | 2012 |
| Palau | 72 | 343 | 2014 |
| Reunion (France) | 1,022 | 114 | 2015 |
| Samoa (formerly Western Samoa) | 481 | 250 | 2014 |
| San Marino | 2 | 6 | 2013 |
| Sao Tome e Principe | 201 | 101 | 2014 |
| Seychelles | 735 | 799 | 2014 |
| Singapore | 12,596 | 220 | 2014 |
| Sint Maarten (Netherlands) | 161 | 347 | 2014 |
| Solomon Islands | 323 | 56 | 2014 |
| St. Kitts and Nevis | 334 | 607 | 2014 |
| St. Lucia | 634 | 345 | 2014 |
| St. Vincent and the Grenadines | 412 | 378 | 2014 |
| Timor-Leste (formerly East Timor) | 453 | 39 | 2014 |
| Tonga | 176 | 166 | 2014 |
| Tuvalu | 11 | 110 | 2014 |
| Vanuatu | 194 | 76 | 2012 |
| Virgin Islands (United Kingdom) | 119 | 425 | 2014 |
| Virgin Islands (USA) | 577 | 542 | 2012 |
Permesiloj:
Mi, la posedanto de la aŭtorrajto por ĉi tiu verko, ĉi-maniere publikigas tiun laŭ la jena permesilo:
| Ĉi tiu dosiero estas disponebla laŭ la Krea Komunaĵo CC0 1.0 Universala Publikaĵiga Dediĉo. | |
| La persono kiu asociis verkon kun ĉi tiu faro dediĉis la verkon kiel publikaĵon forlasante ĉiujn siajn rajtojn al la verko mondvaste sub aŭtorrajta leĝo inkluzivante ĉiujn rilatajn aŭ najbarajn rajtojn permesitajn de leĝo. Oni povas kopii, modifi, distribui kaj ludi la verkon, eĉ por komercaj kialoj, ĉiuj sen peto de permeso.
|
Dosierhistorio
Alklaku iun daton kaj horon por vidi kiel la dosiero tiam aspektis.
| Dato/Horo | Bildeto | Grandecoj | Uzanto | Komento | |
|---|---|---|---|---|---|
| nun | 19:50, 2 aŭg. 2022 | | 800 × 400 (390 KB) | Andrew Pertsev | correction |
| 19:31, 2 aŭg. 2022 |  | 800 × 400 (390 KB) | Andrew Pertsev | cleared | |
| 12:44, 10 mar. 2018 |  | 800 × 400 (606 KB) | Andrew Pertsev | color gradient from red to blue | |
| 20:04, 28 sep. 2015 |  | 800 × 400 (608 KB) | Delphi234 | update | |
| 05:26, 29 maj. 2015 |  | 800 × 400 (607 KB) | Delphi234 | update | |
| 04:32, 3 feb. 2015 |  | 800 × 400 (606 KB) | Delphi234 | legend | |
| 04:22, 3 feb. 2015 |  | 800 × 400 (607 KB) | Delphi234 | add legend | |
| 09:44, 2 feb. 2015 |  | 800 × 400 (604 KB) | Delphi234 | update | |
| 08:07, 2 feb. 2015 |  | 800 × 400 (604 KB) | Delphi234 | consolidate color definitions | |
| 03:03, 1 feb. 2015 |  | 800 × 400 (602 KB) | Delphi234 | {{Information |Description ={{en|1=Prisoner population rate per 100,000 population by country using the following color chart: *{{legend|#FF00FF| >700}} *{{legend|#FF0000| 500-700}} *{{legend|#F58A1F| 300-500}} *{{legend|#FAEE0C| 200-300}} *{{legend... |
Dosiera uzado
La jena paĝo ligas al ĉi tiu dosiero:
Suma uzado de la dosiero
La jenaj aliaj vikioj utiligas ĉi tiun dosieron:
- Uzado en ast.wikipedia.org
- Uzado en ca.wikipedia.org
- Uzado en el.wikipedia.org
- Uzado en en.wikipedia.org
- Uzado en et.wikipedia.org
- Uzado en fi.wikipedia.org
- Uzado en fr.wikipedia.org
- Uzado en gd.wikipedia.org
- Uzado en he.wikipedia.org
- Uzado en hy.wikipedia.org
- Uzado en hyw.wikipedia.org
- Uzado en ko.wikipedia.org
- Uzado en lt.wikipedia.org
- Uzado en lv.wikipedia.org
- Uzado en ml.wikipedia.org
- Uzado en no.wikipedia.org
- Uzado en oc.wikipedia.org
- Uzado en ro.wikipedia.org
- Uzado en sv.wikipedia.org
- Uzado en ta.wikipedia.org
- Uzado en tr.wikipedia.org
- Uzado en uk.wikipedia.org
- Uzado en vi.wikipedia.org