Dosiero:20211109 Frequency of extreme weather for different degrees of global warming - bar chart IPCC AR6 WG1 SPM.svg

Bildo en pli alta difino (SVG-dosiero, 1 200 × 675 rastrumeroj, grandeco de dosiero: 5 KB)
| Jen dosiero de la Wikimedia-Komunejo. La priskribo en ties priskriba paĝo estas montrata suben.
|
Resumo
| Priskribo |
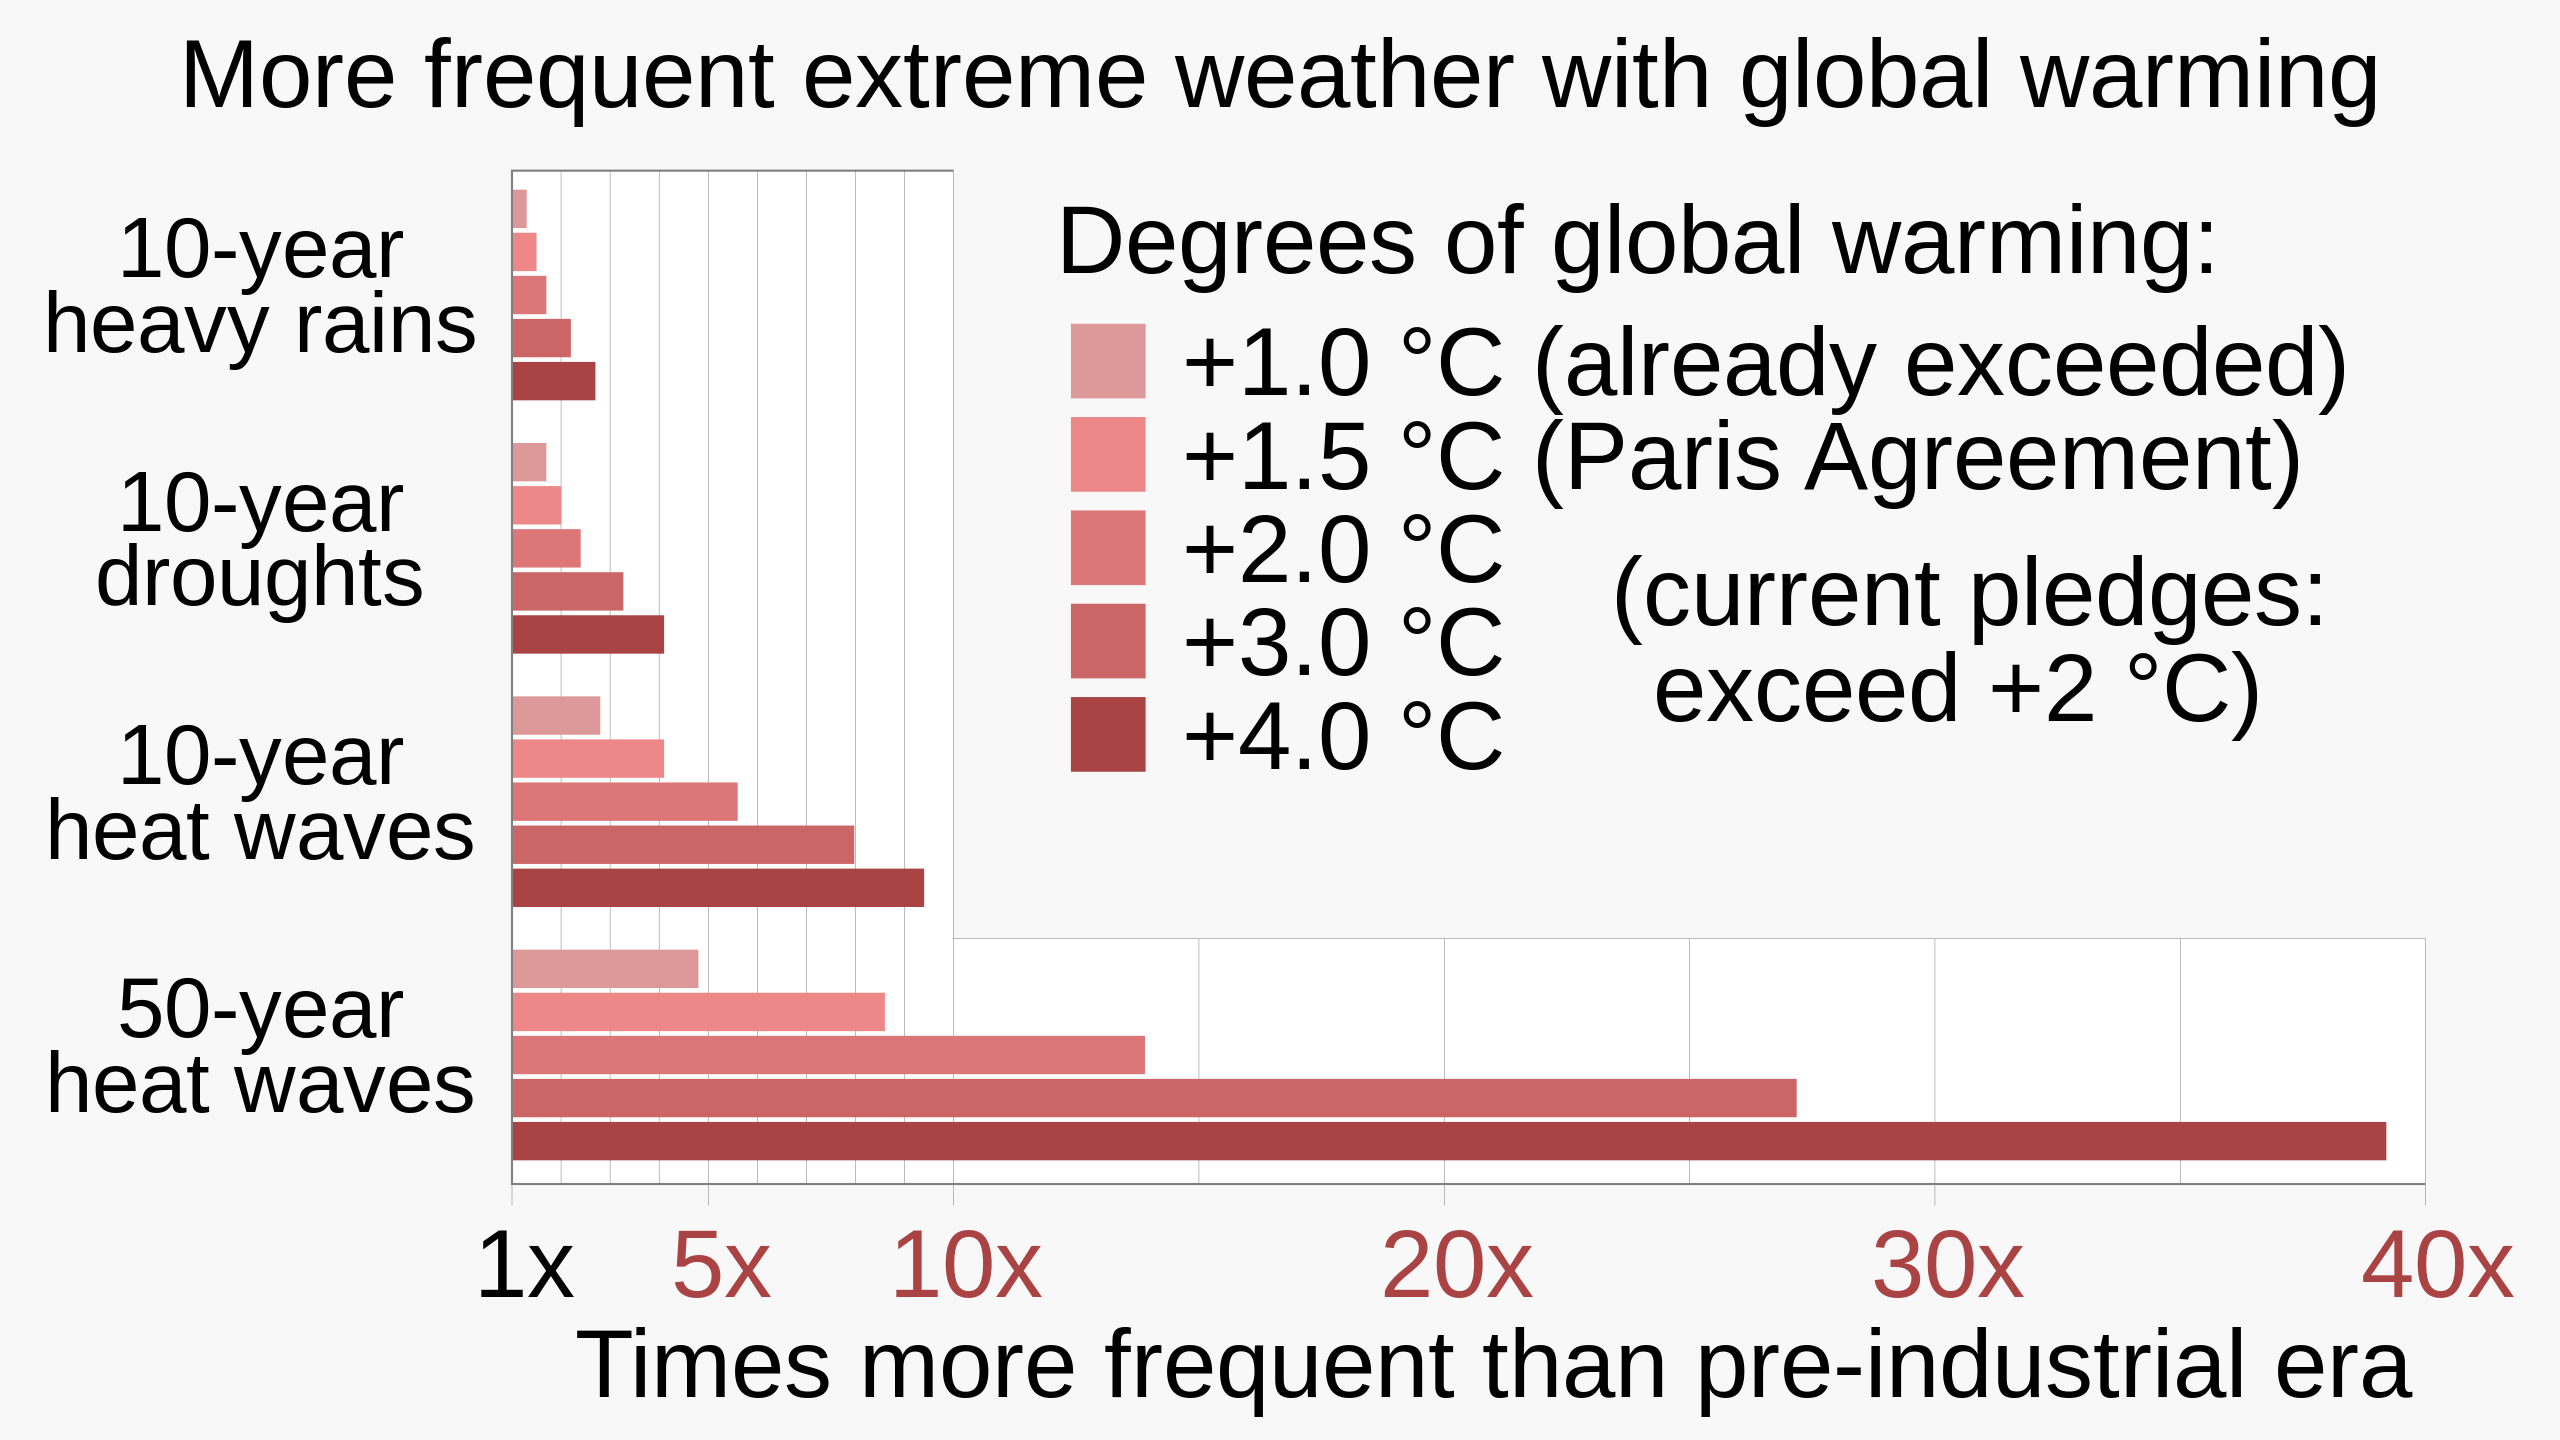
English: Bar chart showing frequency of extreme weather for different degrees of global warming, based on data from IPCC AR6 WG1 SPM (Summary for Policy Makers).
|
||||
| Dato | |||||
| Fonto | Propra verko | ||||
| Aŭtoro | RCraig09 | ||||
| Ceteraj versioj |
|


Related files
The following files are based on Fig. SPM.6 of the Sixth Assessment Report of the Intergovernmental Panel on Climate Change / Summary for Policymakers:
-
 20210809 Projected extremes for different degrees of global warming - IPCC AR6 WG1 SPM.svg
9 August 2021: Line chart of 10- and 50-year datasets (includes frequency, omits intensity) -
 20211107 Projected extremes for different degrees of global warming - 3x10yr area chart - IPCC AR6 WG1 SPM.svg
7 Nov 2021: "L" charts includes both frequency and intensity of the 10-year datasets (omits 50-year dataset) -
 20211109 Frequency of extreme weather for different degrees of global warming - bar chart IPCC AR6 WG1 SPM.svg
9 Nov 2021: Bar chart of 10- and 50-year datasets (includes frequency, omits intensity) -
 20220208 Projected temperature extremes for different degrees of global warming - orthogonal bar chart - IPCC AR6 WG1 SPM.svg
Orthogonal bar chart of 10-year heat waves (only)


Permesiloj:
- Vi rajtas:
- kunhavigi – kopii, distribui kaj publikigi la verkon
- aliigi – modifi, adapti, kompletigi, transformi, uzi la tutan verkon aŭ ties partojn, memstare aŭ en aliaj verkoj
- La verko rajtas esti kunhavigata nur:
- atribuite – Vi devas atribui aŭtorecon, liveri ligilon al la permesilo kaj marki ĉu ŝanĝoj estis faritaj. Faru tion en aprobinda maniero, tamen ne sugestante, ke permesinto aprobas vin aŭ vian uzon.
- samkondiĉe – Se vi rekombinas la verkon, transformas ĝin aŭ kreas devenaĵon bazitan sur ĝi, vi rajtas distribui la rezultan verkon nur laŭ la sama aŭ kongrua permesilo kompare kun ĉi tiu.
Dosierhistorio
Alklaku iun daton kaj horon por vidi kiel la dosiero tiam aspektis.
| Dato/Horo | Bildeto | Grandecoj | Uzanto | Komento | |
|---|---|---|---|---|---|
| nun | 20:44, 29 jul. 2023 | | 1 200 × 675 (5 KB) | RCraig09 | Version 12: remove <tspan> declarations embedded within <text> in the title "More frequent...", to work around ongoing text rendering problems on Wikimedia |
| 20:29, 29 jul. 2023 |  | 1 200 × 675 (5 KB) | RCraig09 | Version 11: manually changing "+1.1 °C today" to "(already exceeded)" (in the English language portion) to future-proof this graphic . . . . retained JP translation <switch> elements without change | |
| 04:57, 6 sep. 2022 |  | 1 200 × 675 (5 KB) | Icosohedral | File uploaded using svgtranslate tool (https://svgtranslate.toolforge.org/). Added translation for zh. | |
| 17:19, 21 dec. 2021 |  | 1 200 × 675 (3 KB) | RCraig09 | Version 9: misc changes per suggestions on this file's Talk page. | |
| 05:31, 22 nov. 2021 |  | 1 200 × 675 (3 KB) | RCraig09 | Version 8: more exact 3.0 C values . . . colors of horizontal axis tick labels | |
| 03:40, 18 nov. 2021 |  | 1 200 × 675 (3 KB) | RCraig09 | Version 7: adding to legend, 2.7 C under current pledges, per discussions at en.wp's Talk:Climate change | |
| 04:58, 17 nov. 2021 |  | 1 200 × 675 (4 KB) | RCraig09 | Version 6: Enlarge some font sizes . . . . change some text | |
| 06:07, 16 nov. 2021 |  | 1 200 × 675 (4 KB) | RCraig09 | Version 5: Used Liberation Sans . . . changed legend to "Present-day =+1.1 C" | |
| 18:25, 13 nov. 2021 |  | 1 200 × 675 (4 KB) | RCraig09 | Version 4: includes thinner, white vertical gridlines that overlay the colored bars, to make it easier to determine extent of the bars. Darker, wider gridlines remain behind the gridlines so they're visible over the white background. | |
| 04:21, 13 nov. 2021 |  | 1 200 × 675 (4 KB) | RCraig09 | Version 3: reduced length of some vertical grid lines; removed most of the plot-area outline. |
Dosiera uzado
La jena paĝo ligas al ĉi tiu dosiero:
Suma uzado de la dosiero
La jenaj aliaj vikioj utiligas ĉi tiun dosieron:
- Uzado en bn.wikipedia.org
- Uzado en de.wikipedia.org
- Uzado en en.wikipedia.org
- Uzado en ko.wikipedia.org
- Uzado en ms.wikipedia.org
- Uzado en pt.wikipedia.org
- Uzado en ru.wikipedia.org
- Uzado en rw.wikipedia.org
- Uzado en tr.wikipedia.org
- Uzado en zh.wikipedia.org