Dosiero:DT fusion rxnrate.svg

Grando de tiu PNG antaŭprezento de tiu SVGa dosiero: 360 × 324 rastrumeroj. Aliaj distingivoj: 267 × 240 rastrumeroj | 533 × 480 rastrumeroj | 853 × 768 rastrumeroj | 1 138 × 1 024 rastrumeroj | 2 276 × 2 048 rastrumeroj.
Bildo en pli alta difino (SVG-dosiero, 360 × 324 rastrumeroj, grandeco de dosiero: 12 KB)
| Jen dosiero de la Wikimedia-Komunejo. La priskribo en ties priskriba paĝo estas montrata suben.
|
Resumo
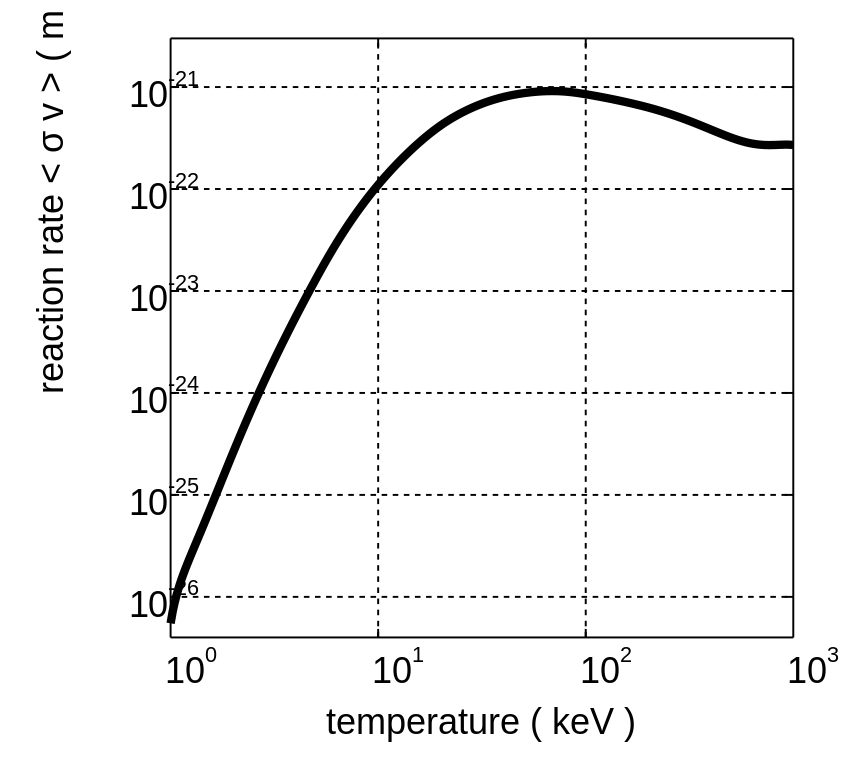
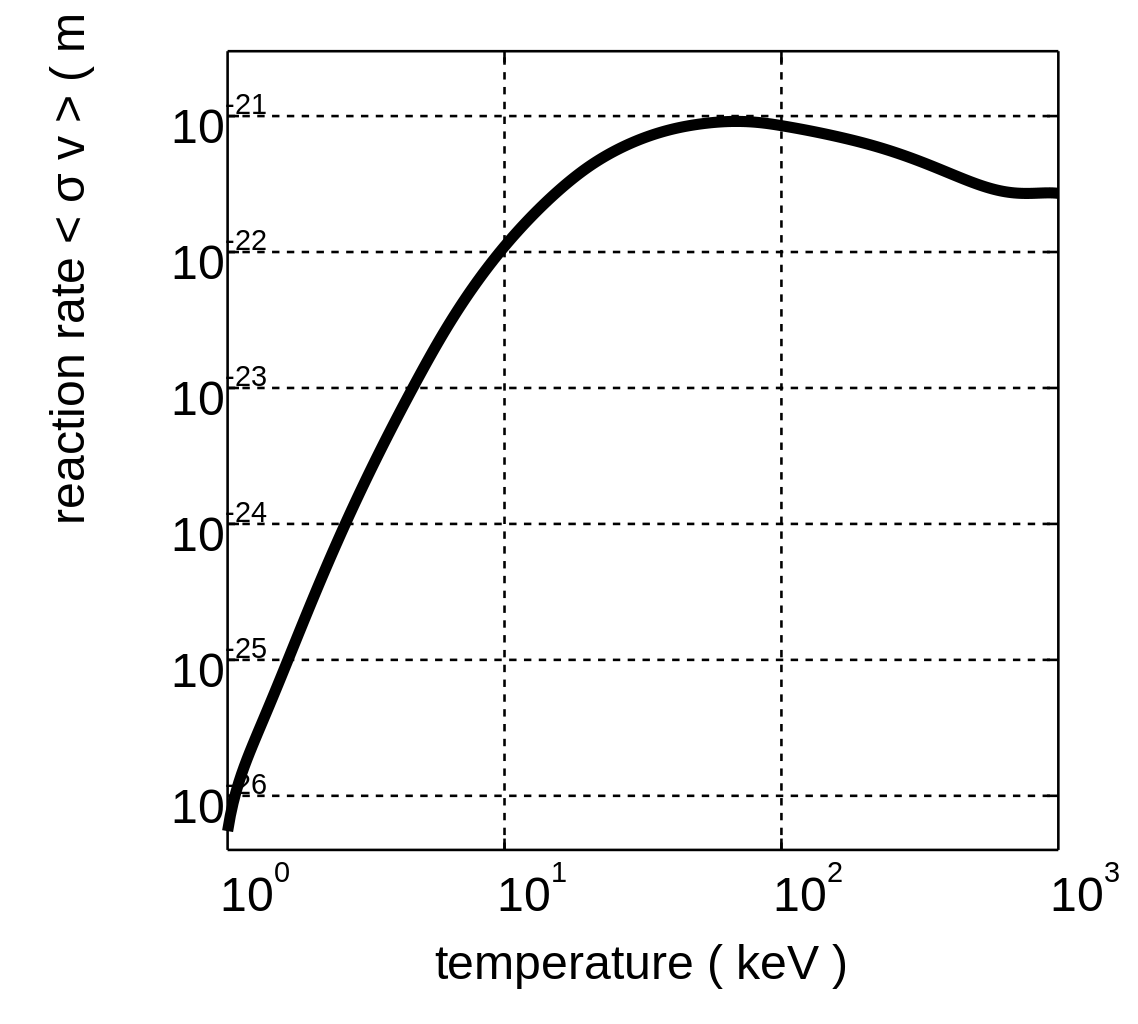
Logarithmic plot of the deuteron-triton fusion reaction rate <σv>, for Maxwellian ion velocity distributions with the same temperature. Created on 10 December 2005 by David Strozzi using Matlab. The curve is a spline interpolation through the data points included on p. 45 of the 2000 revision of the "NRL Plasma Formulary."
Permesiloj:
Ĉi tiu dosiero estas disponebla laŭ la permesilo Krea Komunaĵo Atribuite-Samkondiĉe 2.5 Ĝenerala.
- Vi rajtas:
- kunhavigi – kopii, distribui kaj publikigi la verkon
- aliigi – modifi, adapti, kompletigi, transformi, uzi la tutan verkon aŭ ties partojn, memstare aŭ en aliaj verkoj
- La verko rajtas esti kunhavigata nur:
- atribuite – Vi devas atribui aŭtorecon, liveri ligilon al la permesilo kaj marki ĉu ŝanĝoj estis faritaj. Faru tion en aprobinda maniero, tamen ne sugestante, ke permesinto aprobas vin aŭ vian uzon.
- samkondiĉe – Se vi rekombinas la verkon, transformas ĝin aŭ kreas devenaĵon bazitan sur ĝi, vi rajtas distribui la rezultan verkon nur laŭ la sama aŭ kongrua permesilo kompare kun ĉi tiu.
Dosierhistorio
Alklaku iun daton kaj horon por vidi kiel la dosiero tiam aspektis.
| Dato/Horo | Bildeto | Grandecoj | Uzanto | Komento | |
|---|---|---|---|---|---|
| nun | 00:15, 12 dec. 2005 | | 360 × 324 (12 KB) | Dstrozzi~commonswiki | Logarithmic plot of the deuteron-triton fusion reaction rate <σv>, for Maxwellian ion velocity distributions with the same temperature. Created on 11 December 2005 by David Strozzi using Matlab. The curve is a spline interpolation through the data |
| 22:01, 10 dec. 2005 |  | 270 × 234 (12 KB) | Dstrozzi~commonswiki | Logarithmic plot of the deuteron-triton fusion reaction rate <σv>, for Maxwellian ion velocity distributions with the same temperature. Created on 10 December 2005 by David Strozzi using Matlab. The curve is a spline interpolation through the data | |
| 20:19, 10 dec. 2005 | 270 × 3 (12 KB) | Dstrozzi~commonswiki | Logarithmic plot of the deuteron-triton fusion reaction rate <σv>, for Maxwellian ion velocity distributions with the same temperature. Created on 10 December 2005 by David Strozzi using Matlab. The curve is a spline interpolation through the data | ||
| 19:52, 10 dec. 2005 | 270 × 3 (12 KB) | Dstrozzi~commonswiki | Logarithmic plot of the deuteron-triton fusion reaction rate <σv>, for Maxwellian ion velocity distributions with the same temperature. Created on 10 December 2005 by David Strozzi using Matlab. The curve is a spline interpolation through the data | ||
| 07:24, 10 dec. 2005 |  | 512 × 333 (12 KB) | Dstrozzi~commonswiki | Logarithmic plot of the deuteron-triton fusion reaction rate <v>, for Maxwellian ion velocity distributions with the same temperature. Created on 9 December 2005 by David Strozzi using Matlab. The curve is a spline interpolation through the data points i |
Dosiera uzado
La jena paĝo ligas al ĉi tiu dosiero:
Suma uzado de la dosiero
La jenaj aliaj vikioj utiligas ĉi tiun dosieron:
- Uzado en bs.wikipedia.org
- Uzado en es.wikipedia.org
- Uzado en fr.wikibooks.org
- Uzado en hr.wikipedia.org
- Uzado en ko.wikipedia.org
- Uzado en no.wikipedia.org
- Uzado en pt.wikipedia.org
- Uzado en sh.wikipedia.org
- Uzado en sr.wikipedia.org